Want of Water, Want of Data: The Trans-Atlantic Slave Trade Database and Oceanic Computing
I gave this talk as a part of the SIGCIS 2018 conference Stored in Memory in St. Louis, MO.
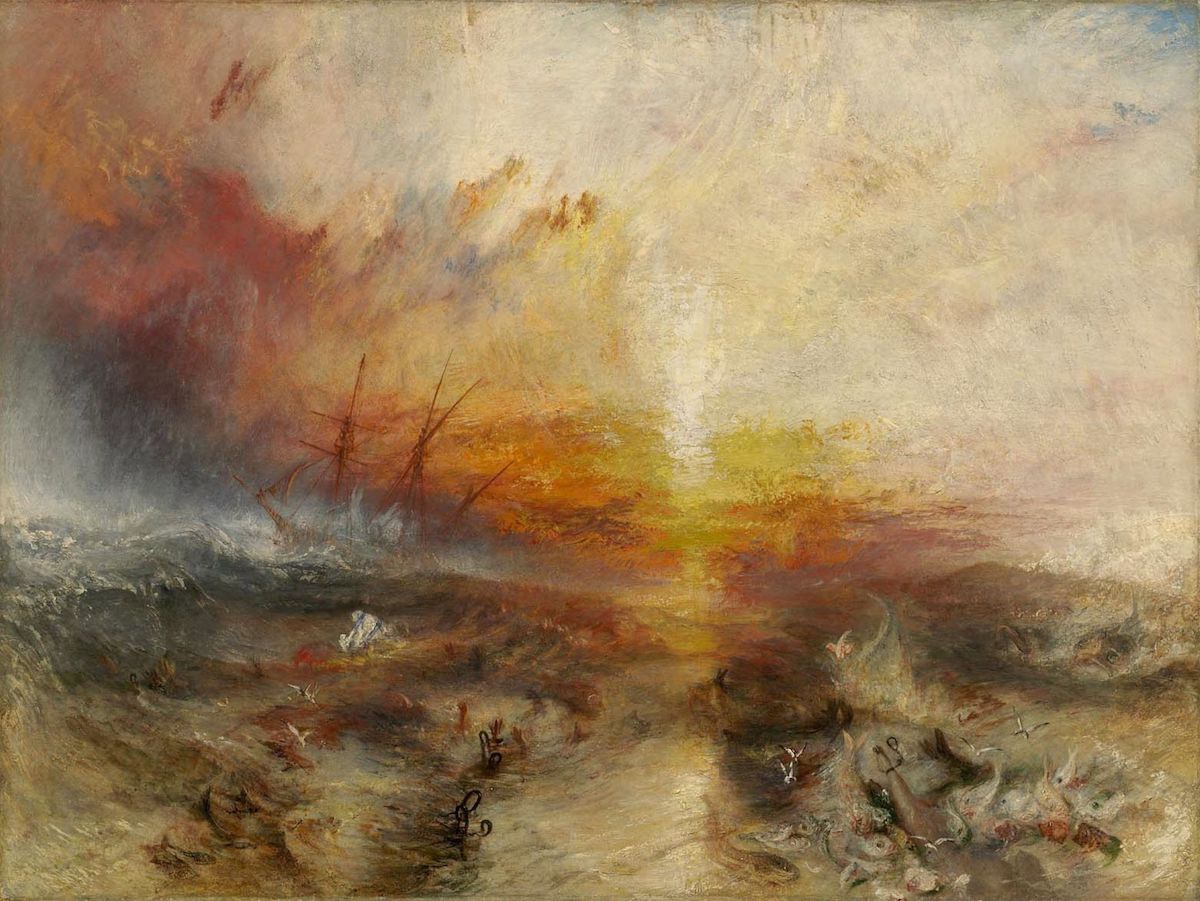
“Our entrance to the past is through memory—either oral or written. And water. In this case salt water. Sea water.”
1
It was for “want of water,” the court documents say, that drove Luke Collingwood, captain of the slave ship Zong, to order one hundred and thirty-two Africans thrown into the sea during the vessel’s 1781 voyage from the Gold Coast to the New World.
Since 1781, the story of the Zong massacre has been told many times, in abolitionist pamphlets, contemporary novels and poems, and academic study. Each telling constitutes an argument for some dimension of order in the face of senseless violence. In this telling, I want to put pressure on its material articulation: the “want of water,” the paper text of an insurance policy, the bones of bodies lost to sea.
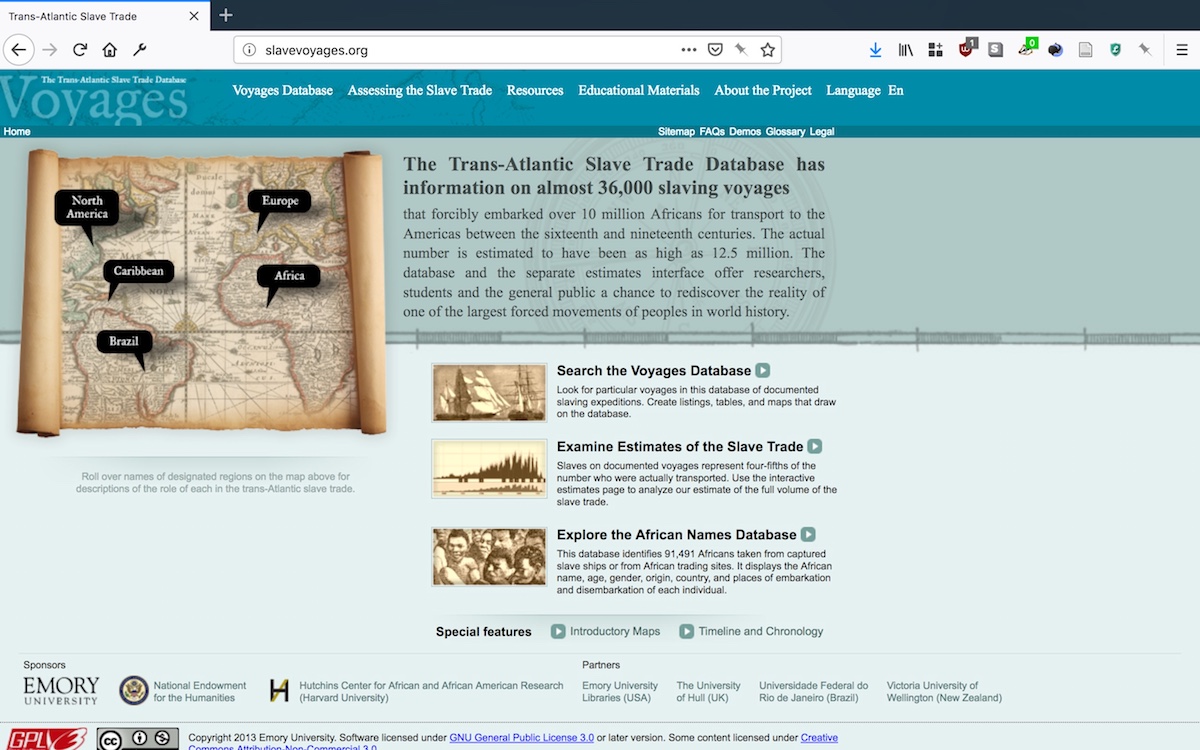
Despite how often we re-tell the Zong’s story, much of its case is indeterminate. We don’t know its true path, the case’s final outcome, or even the precise numbers of Africans captured or killed. In this paper, I take up the Zong’s indeterminacy as an ethical challenge for the design of digital cultural memory projects. To do so, I excavate the Zong as it appears in the Trans-Atlantic Slave Trade Database, or the TASTD, a digital project dating back to the 1960’s and now housed at Emory University. The TASTD provides machine-readable data on thirty-six thousand slave voyages between 1514 and 1866. I’ll read this database not only as an informatic object, an agglomeration of numbers and relationships, but also as an aesthetic object. By doing so, I’ll argue that an ontology of “data” has long structured our understanding of the Middle Passage, from the Zong’s log book through to the TASTD. While informatic forms such as the database or spreadsheet allow us structured access to information, they impoverish our affective and experiential understanding of fundamentally unknowable events. By lingering at the limits of the TASTD to “speak,” I propose alternative models for knowing the Zong through information technologies.
In particular, I offer the ocean as a fruitful counter-model for how digital archival projects come to represent historical knowledge. In this, I am indebted in my thinking to poet and legal scholar M. NourbeSe Philip, whose poem Zong! was the focus of an earlier draft of this project. The ocean accretes memory and exhumes it in unpredictable ways. As a communications medium, the ocean offers a distinctly different set of aesthetic and ethical values than those of the database: it values duration over immediacy, indeterminacy over exactitude, leaky memory over dry storage. By speculating with data and water, I argue we can develop new techniques for foregrounding rather than submerging indeterminacy in digital humanities work.
In 2006, Emory received an NEH grant to construct the open-access website that eventually became slavevoyages.org, the TASTD’s current home. The data themselves date back to work begun in the 1960’s by historian Herbert S. Klein. The data were originally available as a series of published volumes and on CD-ROM, but now, under Emory’s auspices, the 30.6 megabyte database is a free resource for scholars and the public alike.
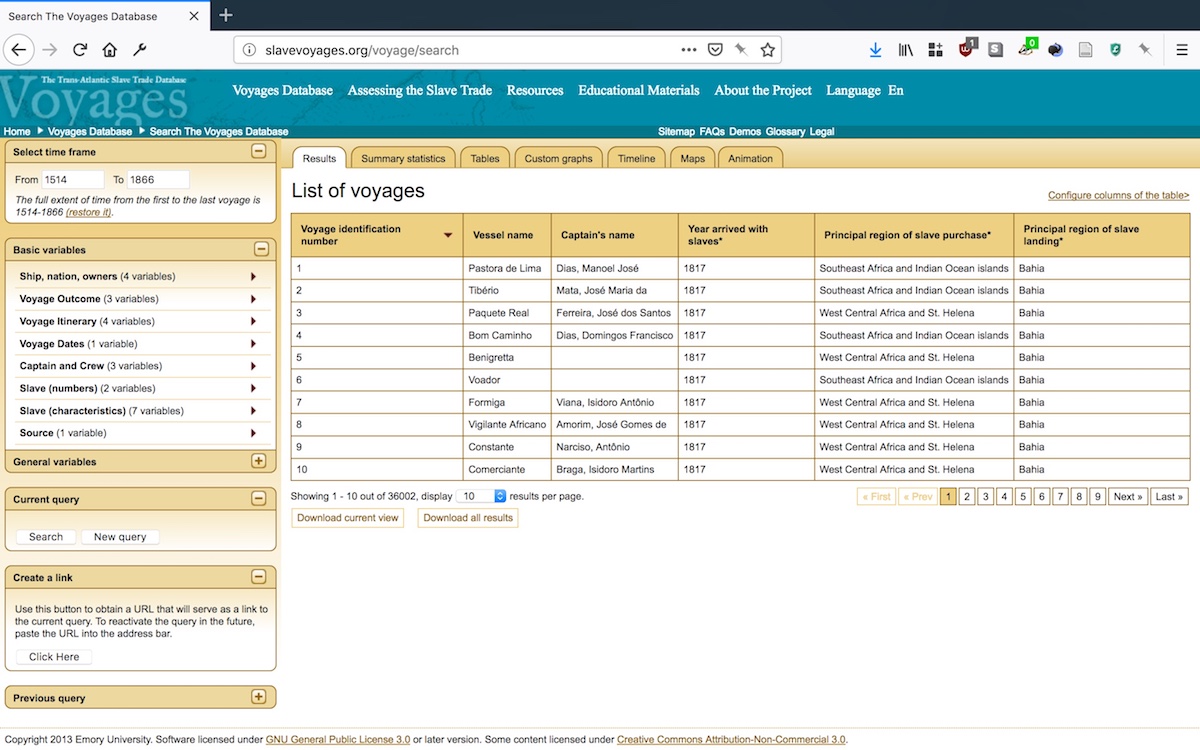
David Eltis, one of the project’s PIs, estimates that the TASTD’s thirty-six thousand voyages accounts for around eighty percent of all voyages carrying enslaved Africans between 1514 and 1866.
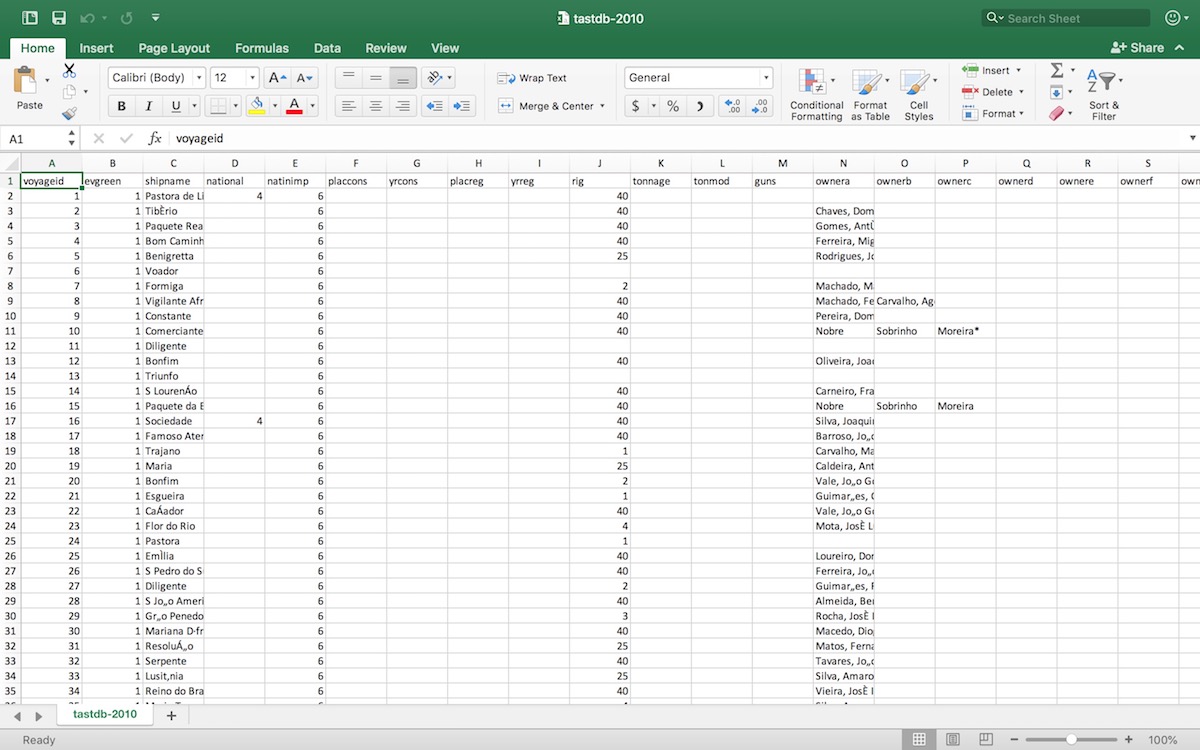
The site’s interface takes the form of a left column of variables that one can select and manipulate to delimit the information that appears on the screen. Tabs that run the width of this body provide different ways of framing the data, from a basic return in a spreadsheet to more complex timelines, maps, and animations. Clicking through to a single voyage provides a spreadsheet with information about that voyage, any archival images that may correspond to it, and a map of the ship’s route.
It’s worth pausing to distinguish between two types of variables that exist in the TASTD. On the one hand, there are “direct” variables, those drawn directly from archival sources—log-books, newspaper reports, court cases. And on the other, there are “imputed” variables, those inferred and calculated by the scholars assembling these data. These two variable types mix together, though imputed variables are tagged with asterisks. This marking is far from transparent. One would have to read fairly far into its documentation to learn which variables are which and what the graphical system entailed. Moreover, there are some variables, such as “flag,” that have both archival and imputed iterations. I don’t intend this as a slight against the site’s design. Indeed, I commend its authors in foregrounding more than most of the labor and decisions that went into shaping this resource. Rather, I intend to gesture to the tricky tensions of assembling such a resource: many of the data that one would ostensibly most want to know about these voyages, such as mortality rates or specific ports of departure, are by their nature not formally recorded in ledgers and logs. They are gaps and silences in our archive. The TASTD then makes the choice, as we all must make for ourselves, whether to derive these data through interpretive acts.
Here we might recall Lisa Gitelman’s and Virginia’s Jackson’s argument that “data need to be imagined as data to exist and function as such.”
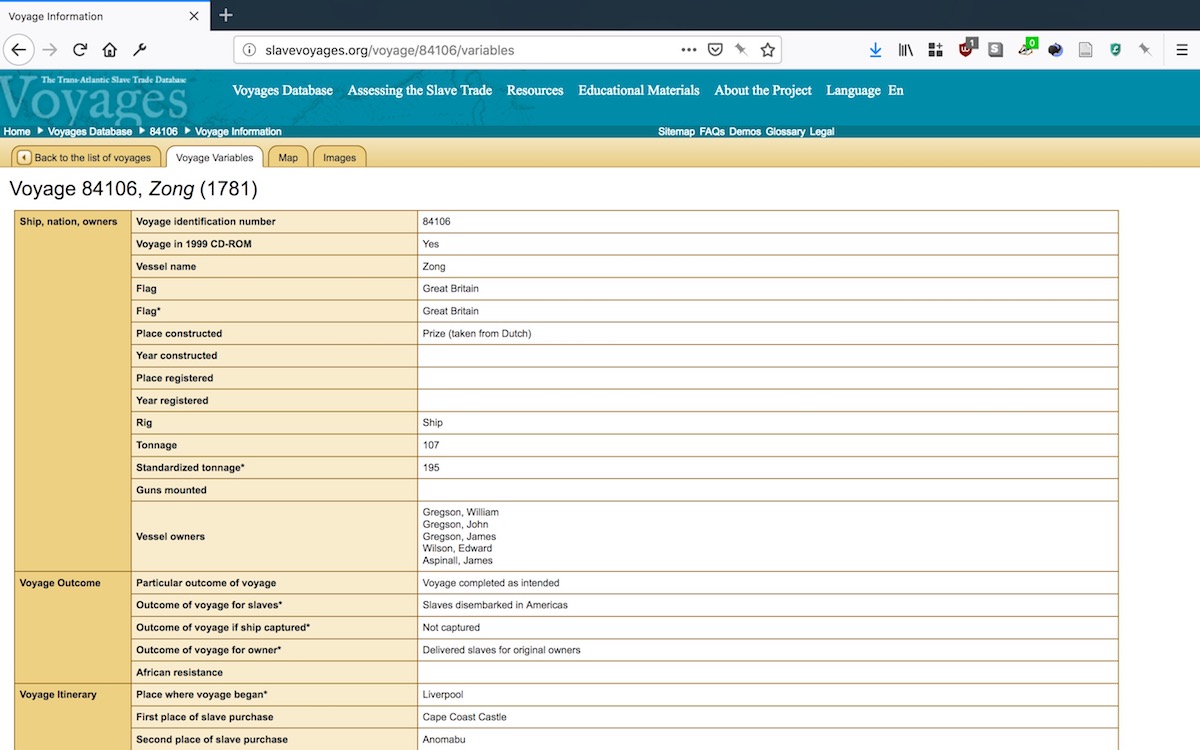
In the database, the Zong’s voyage is ID number 84106. It flew under the British flag; it was a prize from the Dutch, captured in battle. Its voyage to Africa began on March 5th, 1781; it left the continent on September 6th, and reached Jamaica on December 28th. Its “particular outcome of voyage,” the data tell us, was “completed as intended.” The massacre is not explicitly encoded as a quantitative or qualitative variable. It rather emerges in the imputed interstices between two others: total slaves embarked, 440; total slaves disembarked, 208. Mortality rate: 53 percent.
But numbers, as we all know, are slippery things. What appears fixed and authoritative within the frame of the database is the product of tireless archival research, micro-choices to include one set of numbers over another, and no small amount of arbitrary chance. The TASTD’s numbers are no different, although in their subject matter they carry a particularly heavy ethical weight. Indeed, Baucom, Philip, and Erin Fehskens,
We’re running up against what Miriam Posner has noted as the inherent contradiction of “humanities data”: that data, as material, demand fixity.
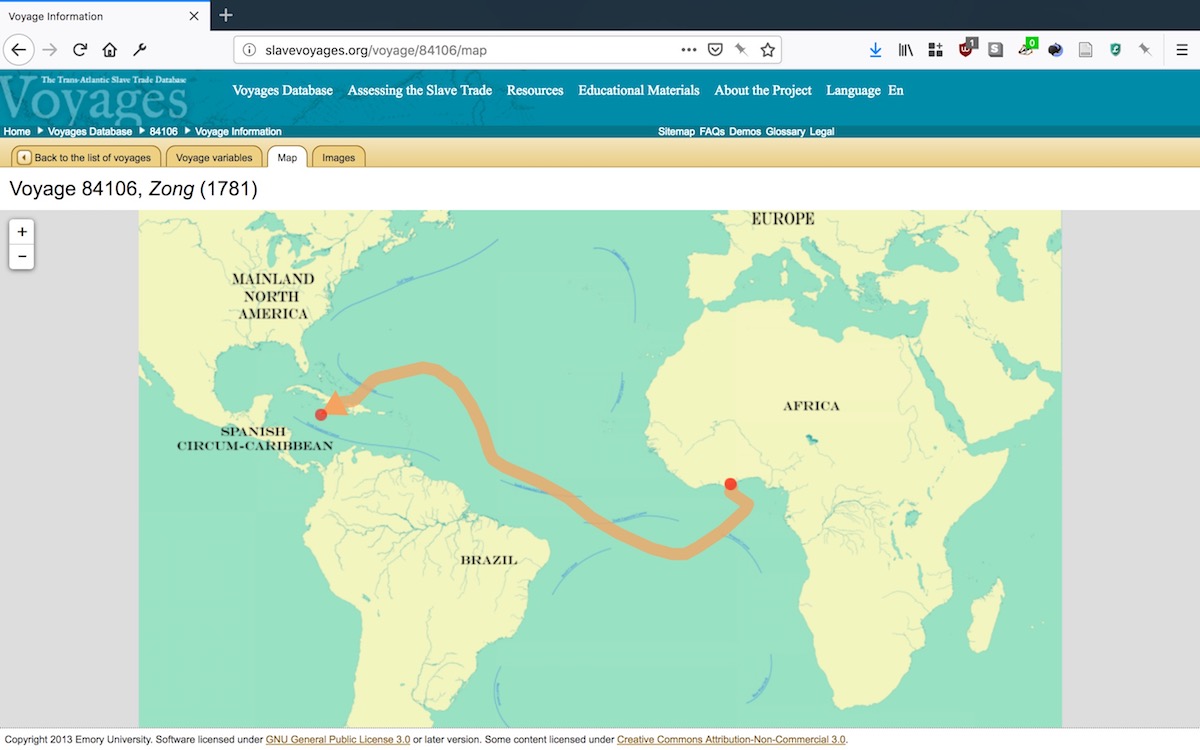
These tensions get laid bare most often when data as asked to speak in visual forms. (Indeed, the challenge of making timelines out of humanities data prompted Posner’s observation in the first place.) For the TASTD, the most potent visual examples are the maps that accompany each voyage entry, tracing the ostensible route the ship took. Here’s the map for the Zong. These maps identify ports of departure and arrival, and give a sense of the movement of the voyage itself. But notably, the database only stores variables for beginning and ending ports, and has no geographic data for the actual voyage itself. Specific moves—the small bend east at the beginning of the Zong’s voyage, its uncharacteristic curve north before reaching Jamaica—are inferred, we must imagine, on a case-by-case basis, perhaps from prevailing winds or historically typical routes.
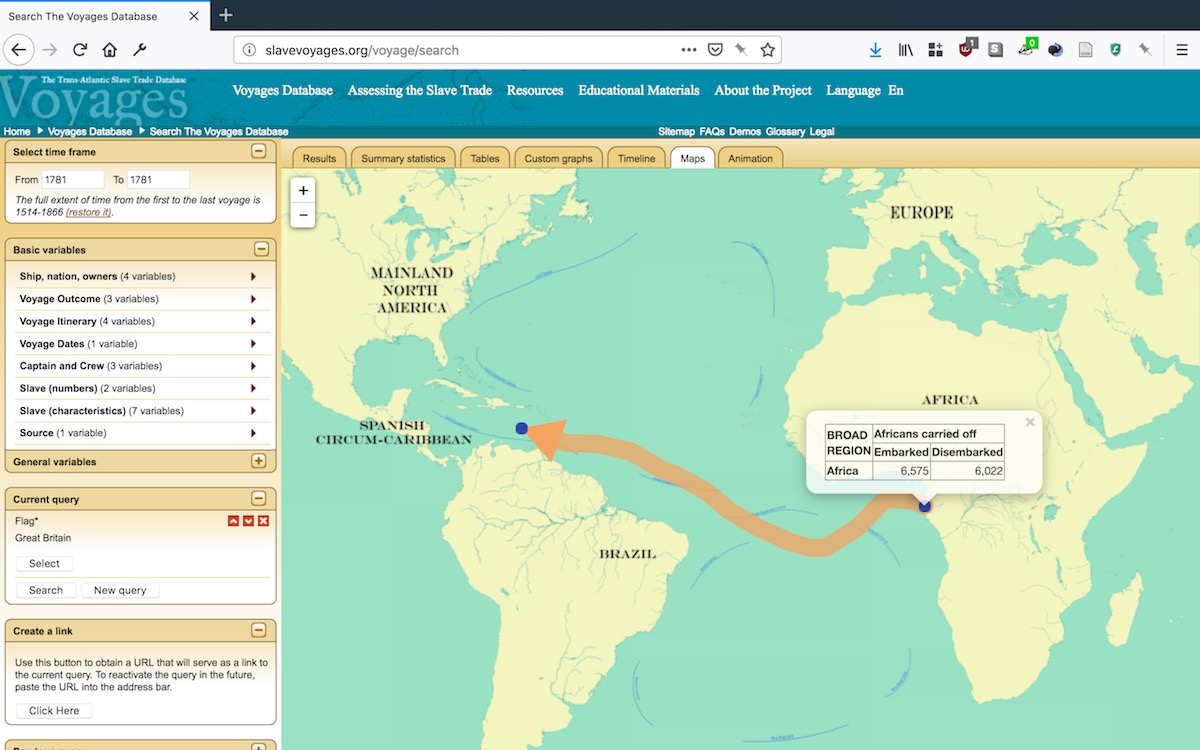
Indeed, we can see the Zong’s deviation from the norm when sorting for all vessels flying the British flag in 1781. But the precise contours of this deviation are still conjecture, and when inscribed on a map begin to signify with an unreckoned weight. Marisa Parham, writing about a different map that historian Ben Schmidt produced of eighteenth- and nineteenth-century shipping paths from the US Maury collection, notes that these kinds of speculative cartographic projects occupy a liminal space between meaning and non-meaning. They are “compelling,” she argues, “because [they] elicit a sense of truth an evidence while simultaneously demonstrating nothing. [They are suggestive] because we are left to imagine the histories fanned by those dark wisps.”
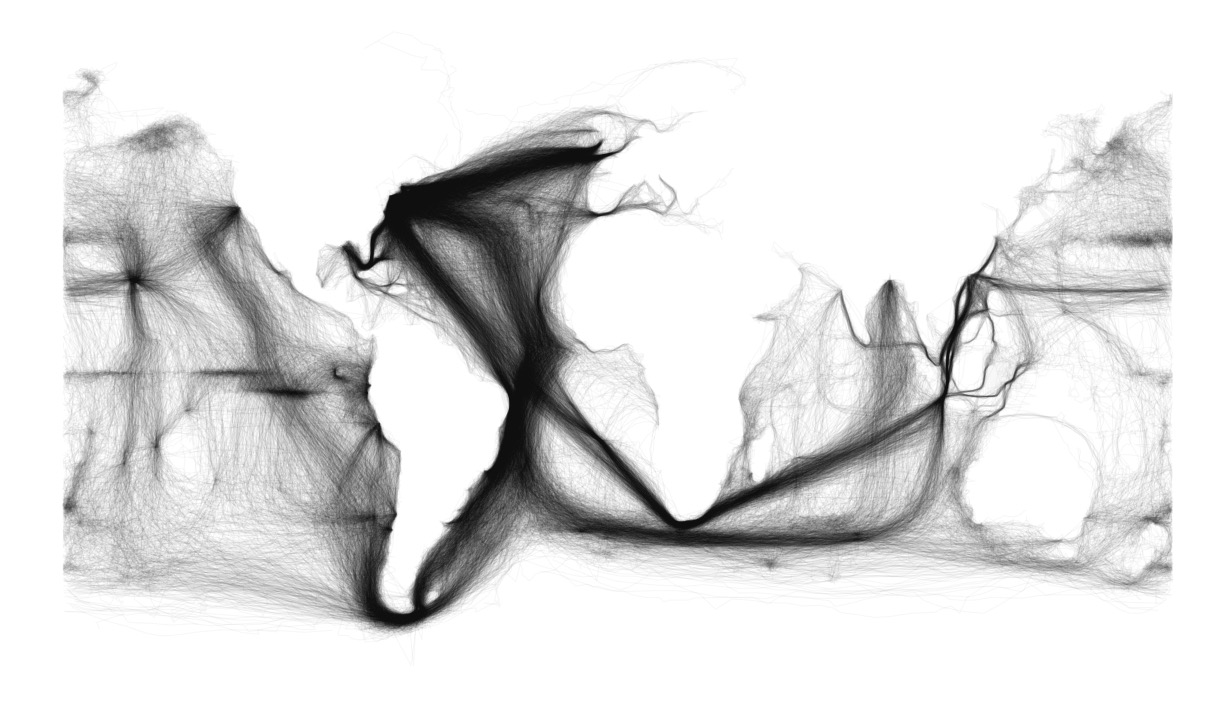
Which is not to argue against these maps’ utility as scholarly, aesthetic, and affective objects. Rather, I want to recuperate aesthetics as a category of knowing, being, and experiencing that data-driven digital humanities projects tend to avoid, even as we’re all painfully aware of how much “prettier” we’d like our websites to be. Like Parham, I find much to recommend in negotiating the troubling space between the feeling of signification that the presence of data provokes and the absences they reveal upon closer inspection.
And, like Philip, whose work has haunted this talk, I find much to recommend in turning to water—water as the foundation and counter-figure of reading the Middle Passage as data.
The turn to elementality is a growing presence in contemporary digital media studies. Scholars such as Jussi Parikka, Nicole Starosielski, and John Durham Peters, among others, have begun to put media studies and ecological critique in conversation, asking how we understand the planet and its materiality as the grounds for digital media production and transmission. Peters in particular has been foundational to this turn. He argues that elements both classical and chemical provide a hermeneutic through which theorists can connect technicity to ecology. Rather than thinking media as environments, he asks us to think “environments [as] also media.”
Digital media have long taken up oceanic and navigational metaphors. We surf the internet and manage floods of information. Web browsers trade on the exploratory, whether in name (Internet Explorer, Netscape Navigator, Apple Safari) or branding. Even as the oceanic blends with more terrestrial formations like “a series of tubes” or “the information superhighway,” the digital carries a breadth, depth, and an aqueous turbidity. Like the sea, the digital is vast and unknowable, though traversable if one takes along the right tools. Movement across, under, or through both requires mediating technologies that simultaneously mark out space and propose epistemologies. Navigation is a process of rationalization, as in the latitude and longitude of the sea chart or the linear historical view of the web browser.
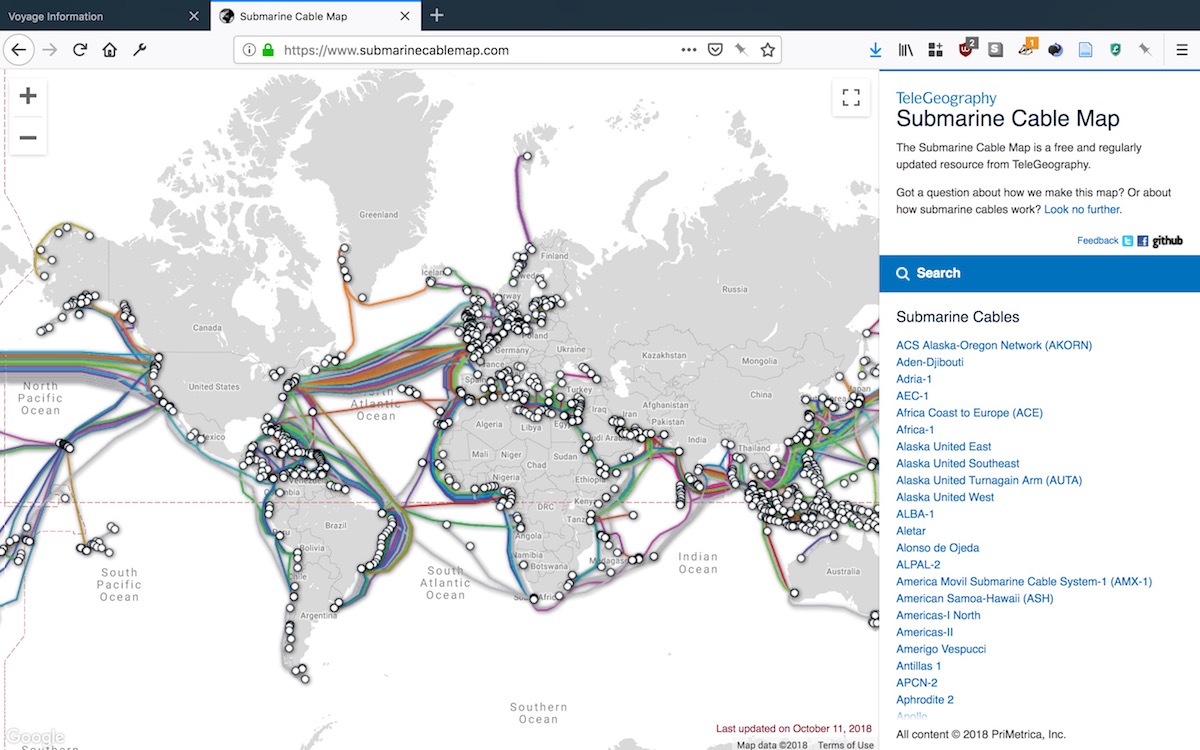
Nicole Starosielski’s The Undersea Network reminds us of the historical inertia of communications technologies. The undersea internet cables of her study “follow the contours of earlier networks, layered on top of earlier telegraph and telephone cables, power systems, lines of cultural migration, and trade routes.”
What I propose here at the end that turning to the ocean in this moment teaches us is the affective power of data, and how we might make that power more explicit, rather than incidental, in our data-driven cultural memory projects. Attention to affect and aesthetics must be more than in the service of usability or beauty. Aesthetics can teach us indeterminacy where the form of the database definitionally cannot.
To complete Philip’s quote that served as my epigraph:
“Our entrance to the past is through memory—either oral or written. And water. In this case salt water. Sea water. And, as the ocean appears to be the same yet is constantly in motion, affected by tidal movements, so too this memory appears stationary yet is shifting always. Repetition drives the event and the memory simultaneously, becoming a haunting, becoming spectral in nature.”
12
Philip, N. NourbeSe. Zong!, Wesleyan UP, 2008, pp. 201. ↩︎
Much of this detail comes from the below-mentioned court case, Gregson v. Gilbert, reproduced in full in Philip, pp. 210–11. ↩︎
Eltis, David. “Introduction.” The Trans-Atlantic Slave Trade Database, Emory University, 2010. http://slavevoyages.org/voyage/understanding-db/methodology-1. ↩︎
Gitelman, Lisa, and Virginia Jackson. “Introduction.” “Raw Data” Is an Oxymoron, edited by Lisa Gitelman, MIT P, 2014, pp. 1–14, pp. 3. ↩︎
Baucom, Ian. Specters of the Atlantic: Finance Capital, Slavery, and the Philosophy of History. Duke UP, 2005, pp. 5. ↩︎
Fehskens, Erin M. “Accounts Unpaid, Accounts Untold: M. NourbeSe Philip’s Zong! And the Catalogue.” Callaloo, vol. 35, no. 2, Aug. 2012, pp. 407–24. ↩︎
Philip, pp. 208. ↩︎
Posner, Miriam. “Humanities Data: A Necessary Contradiction.” Miriam Posner’s Blog, 25 June 2015. http://miriamposner.com/blog/humanities-data-a-necessary-contradiction/. ↩︎
Parham, Marisa. “Haunting down Data.” Black Haunts in the Anthropocene, Oct. 2014, http://blackhaunts.mp285.com/haunting-down-data/. ↩︎
Peters, John Durham. The Marvelous Clouds: Toward a Philosophy of Elemental Media. U of Chicago P, 2015, pp. 7. ↩︎
Starosielski, Nicole. The Undersea Network. Duke UP, 2015, pp. 2 ↩︎
Philip, 201. ↩︎